Designing Clarity
A role-based dashboard to simplify complex data and streamline business insights
Dashboard Design
Mortage & Lending
2024

Project Overview
The project involved designing a new customer-facing dashboard that would serve as a central hub for managing audits, loans, rebuttals, and task actions.
Our mission: to design a dashboard that delivers clarity, speed, and immediate actionable insights at a glance.
Role: Lead UI/UX Designer
Team: Product Manager, Backend Engineer, Business Analyst
Duration: 6 weeks
Problem Statement
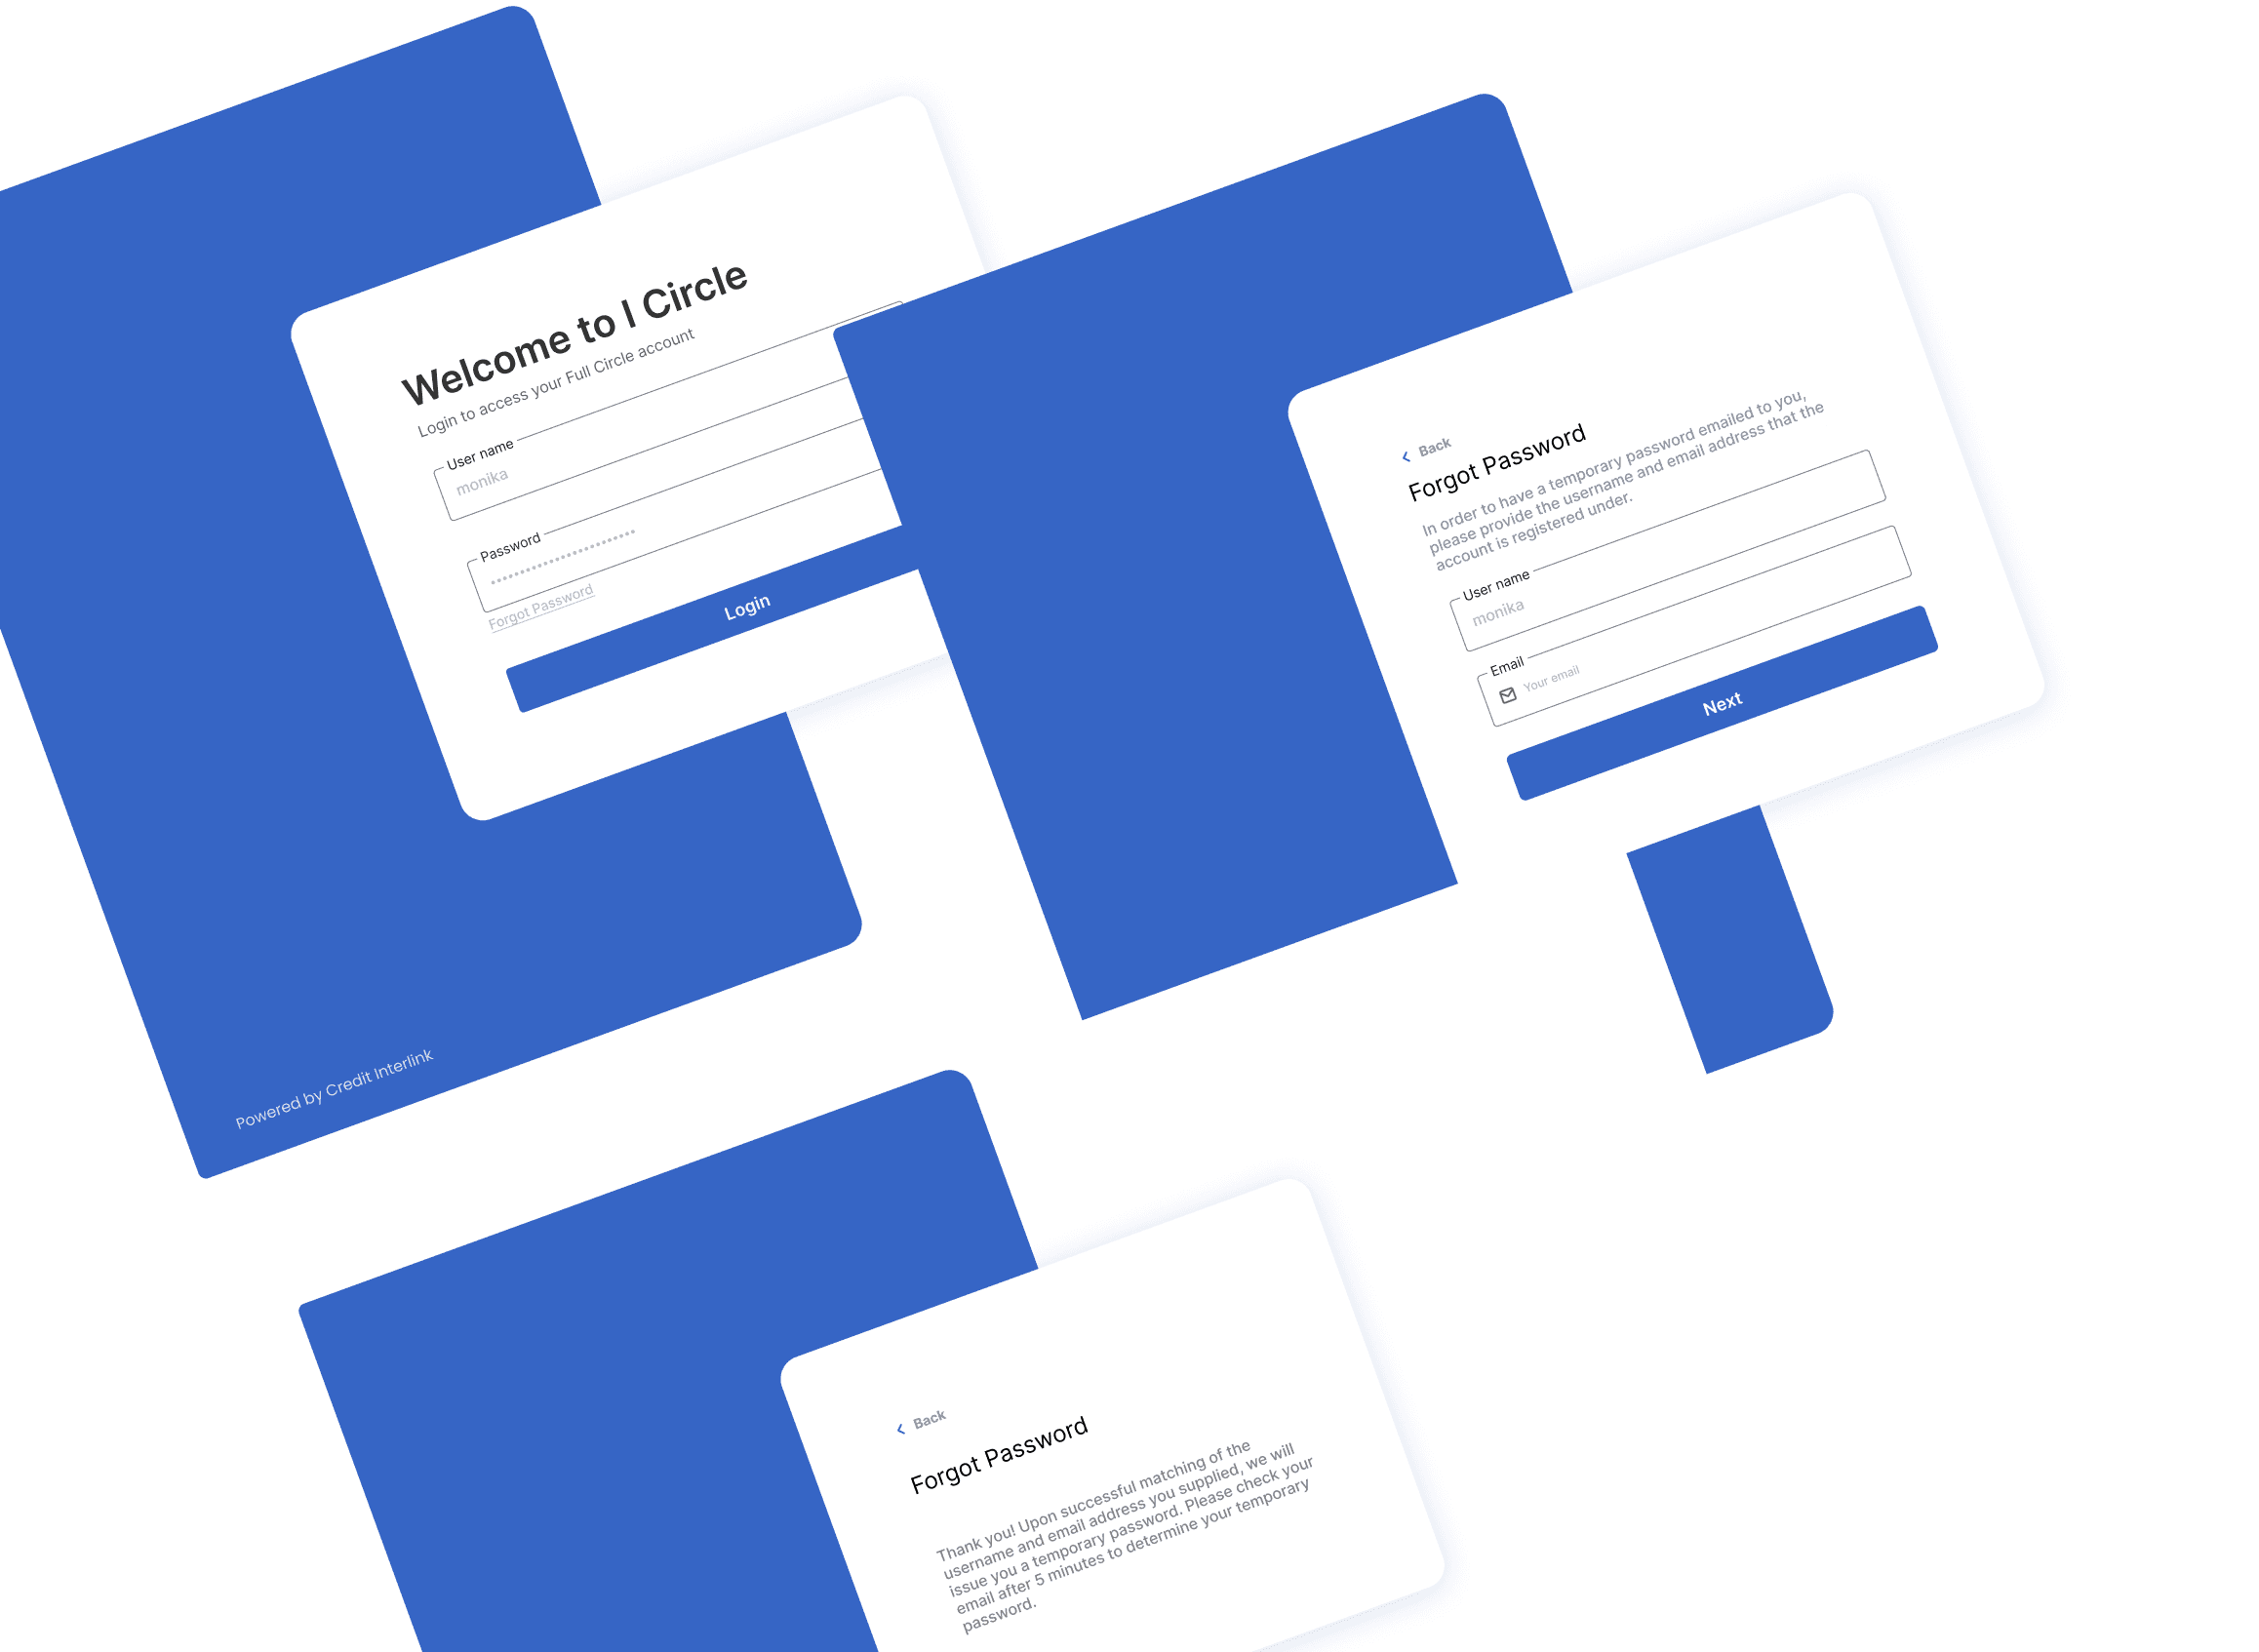
The goal was to design a new customer-facing portal that would allow users to manage audits, loans, rebuttals, and tasks from a single intuitive dashboard.
Since there was no existing portal, the challenge was to create a clear, scalable experience from scratch — one that balanced complex information without overwhelming users, supported daily task workflows, and delivered insights at a glance.
Key challenges included:
Structuring large volumes of audit and loan data meaningfully
Prioritizing critical actions for users to address quickly
Designing clean, approachable visuals to encourage platform adoption
Building an experience flexible enough to evolve with future business needs
Design Goals
Create a modular, role-driven dashboard layout
Prioritize top KPIs (Audits, Loan Status, Rebuttals, Actions Required)
Visualize trends and distributions simply
Make task actionability immediate and effortless
Design Strategy & Decisions
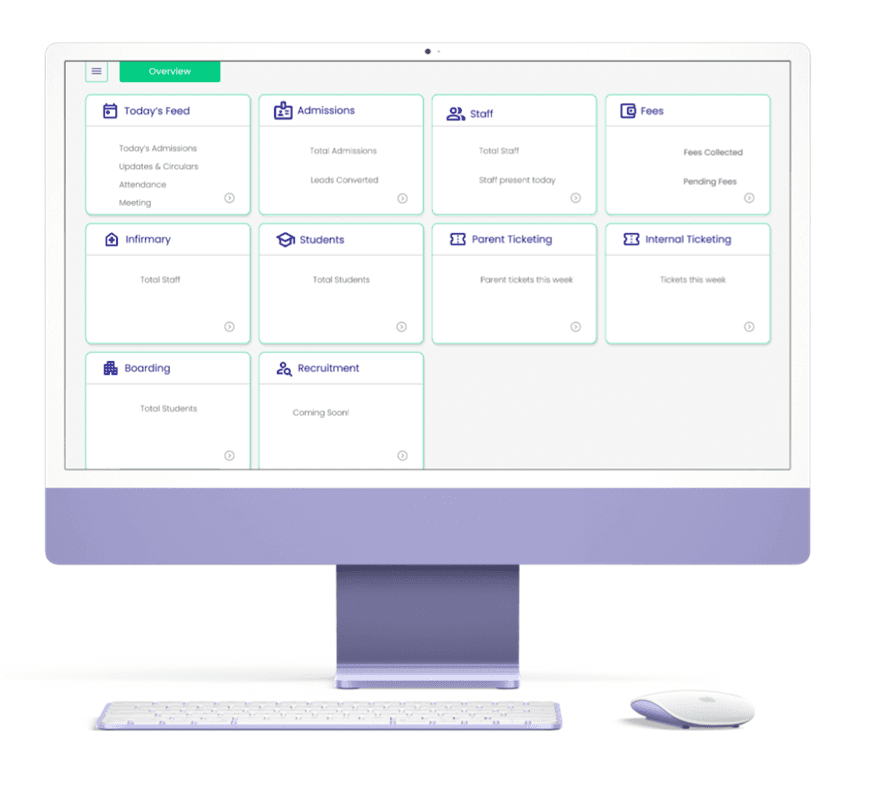
Dashboard Structure
Top Section: Personalized welcome, search, and quick access filters (Date Range, Notifications, Profile).
Overview Cards: Quick KPIs with key figures (e.g., Total Audits, Loan Status, Rebuttals, Actions Required), color-coded for urgency.
Trending Reports:
Audit Trends Graph: Line chart for monthly audit findings vs. audit completions.
Audit Status Donut Chart: Immediate status breakdown (Open, In Review, Pending, Closed).
Sectional Navigation
Horizontal tabs for Audits, Loans, and Rebuttals, keeping navigation lightweight and focused.
Actionable cards (e.g., "Review Loan Application," "Respond to Rebuttal") surfaced immediately with status indicators (High, Medium, Low).
Visual Language
Soft pastel tones to minimize visual fatigue for high-volume data users.
Distinct iconography for different categories (Audit, Loan, Rebuttal).
Progress indicators and color consistency for task states (Pending = Yellow, In Review = Orange, Closed = Green, Failed = Red).
Reflection
This project reaffirmed my belief that good dashboard design is not about displaying everything — it’s about surfacing what matters most, when it matters most.
Balancing visual hierarchy, modular design, and user empowerment was key to creating a tool that didn't just present data — it moved people to act.